The Dalí Museum Eye-Tracking Exhibit Design

ROLE

Product Designer

DURATION

1 Year

TEAM

3  Project Managers, 5 Designers, 4 Software Engineers

TOOLS

Figma, Unity, Tobii Nano Pro

SKILLS

User Research, Storyboarding, Interaction Design, Copywriting

Background

The Salvador Dalí Museum in St. Petersburg, Florida, welcomes 400,000 annual visitors and houses the largest collection of Salvador Dalí's work outside of Spain. The museum is a driving force for the harmonious blend of art and technology in the museum space. They have launched both AR and VR exhibits and were interested in adding eye-tracking to their resume of digital experiences.

In anticipation of a 42 million dollar expansion that would house the museum’s immersive experiences, the Dalí Museum partnered with the Digital Applied Learning and Innovation (DALI) Lab to create an interactive eye-tracking experience.

Challenge

How can we leverage eye-tracking technology to enhance visitors' understanding of Salvador Dalí's complex artwork?

Role

Over the course of the year, I conducted industry research, performed user testing and interviews, synthesized findings, created storyboards, prototyped screens, and traveled to Florida to install the beta launch of our product. Amidst the changing team structure every three months, and as the sole end-to-end designer, I facilitated onboarding for new designers, ensuring a clear understanding of project requirements, goals, and scope.

Solution Overview

We created a three-minute interactive experience that explores user perceptions of a Dalí painting. After gathering gaze data, we present users with heat maps and gaze path playbacks of their view of a painting. Then, we provide a comparison between the user’s view with that of a curator, before guiding users through the painting with detailed insights into the painting’s background, significance, and motifs. Lastly, users have the option to save their data or share it on social media.
How do I look?
This exhibit employs cutting-edge eye-tracking technology to educate museum goers about Salvador Dalí's artwork and to enable them to compare their perspective of Dalí’s art with that of an expert.
Process Overview

RESEARCH

Industry Research

We conducted industry research on digital museum exhibitions worldwide to explore current technology trends in the museum space. Museums like The Cleveland Museum of Art and the Amsterdam Van Gogh Museum have already implemented eye-tracking technology in their galleries.

Curator Interviews

After familiarizing ourselves with the intersection of art and technology, we familiarized ourselves with the Dalí paintings that would be part of the experience. The museum selected 11 paintings, spanning different periods of Dalí’s life and encompassing diverse themes and concepts.

We conducted three hour-long interviews with two museum docents to identify and deepen our understanding of key features in each of the 11 paintings. The features identified during these conversations informed future decisions regarding which elements to highlight for viewers during the experience.

TEST

User Tests

We conducted a research study focused on the interaction between viewers and the 11 paintings, coupled with an exploration of eye-tracking technology. We had four main goals in mind: gather preliminary eye-tracking data, identify a preferred navigation method, assess user enjoyment, and capture user takeaways. To streamline user testing, we divided the 11 paintings into three testing groups, limiting each testing session to 30 minutes. The testing process had three distinct phases—pre-test interview, eye-tracking test, and post-test interview.

Test Parameters

Length:
30 minutes
Participants
33 participants
Location:
Hanover, NH and Columbia, MD
Study Type:
Moderated user interview and usability testing

Recruitment

Given the museum’s diverse set of annual visitors, we sought a diverse user base for testing. We recruited participants of varying ages, gender identities, art backgrounds, and interest levels in art. Using connections within the Dartmouth community, including students, professors, and the Hood Museum at Dartmouth College, we successfully enlisted 33 participants aged 14-70 with a spectrum of art experience and interest.

Procedure

Key Research
Insights

Our 33 user tests and interviews generated substantial quantitative and qualitative data. Through the synthesis process, we populated age, experience, and interest charts, in addition to affinity maps to identify user trends. We unveiled the following key insights:

Dense descriptions

Participants found the painting descriptions lengthy and complex, often requiring multiple readings for comprehension.

Navigation preferences

While mouse-control navigation was preferred for its ease and familiarity, participants enjoyed the novelty of eye-tracking navigation. Some noted that hands-free navigation could reduce equipment sanitation needs.

Interest levels

Several participants, including those with limited initial interest in art, reported an increased interest in Dalí's work following the experience. They found that feedback on their viewing patterns enhanced their engagement with the artwork.
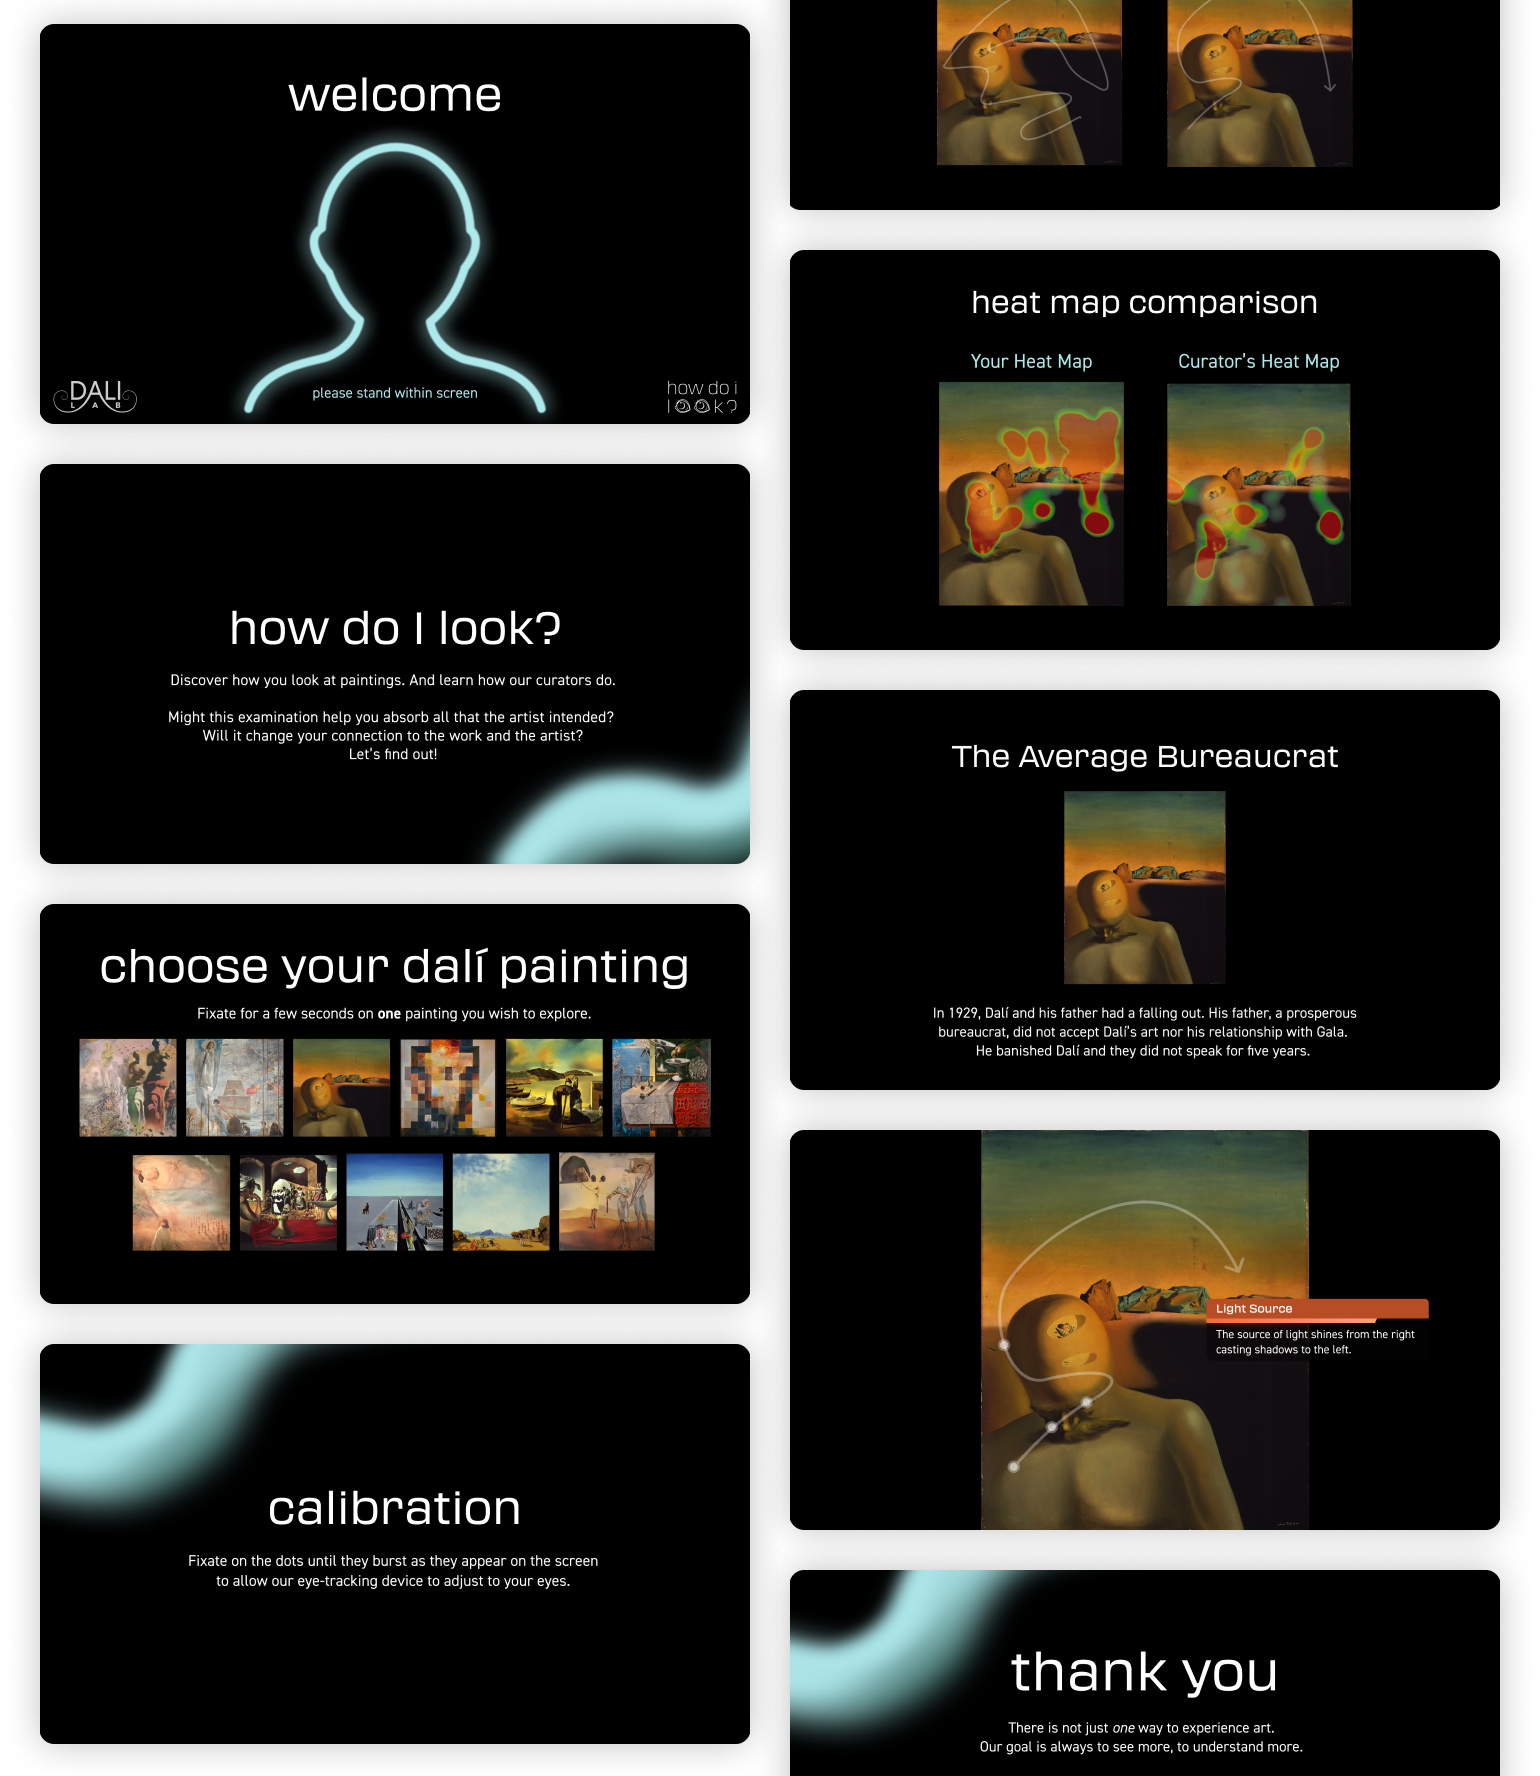
Data comparison

Participants expressed a strong interest in comparing their viewing data with that of an experienced art observer.

Pre and post description view

Painting descriptions altered participants' perceptions, leading them to notice previously overlooked features and to deliberately seek out described elements during subsequent viewings.

DEFINE

Needs and Constraints

One of the main challenges we encountered was reconciling user needs with client constraints. Research highlighted several user needs, but we had to navigate the integration of these needs with the museum’s limitations as we moved forward.

IDEATE

Storyboards

Considering the user needs and client limitations, we brainstormed various user experiences. While pushing creative bounds a bit, we explored concepts like memory retention games and a museum scavenger hunt before ultimately honing in on an experience centered around data comparison between user and curator perspectives.

Theme/UI Brainstorm 

As we explored potential UI themes, our goal was to create visually captivating designs that did not detract from the artwork, as any distraction from the art could impact the gaze data collected. We recognized a thematic connection between our experience and Salvador Dalí’s artwork — eyes! We capitalized on this connection, presenting several eye-related explorations to our clients.

PROTOTYPE

Key Design Decisions

The user flow posed the greatest challenge in terms of our design decisions. Early project discussions with the client focused on the guided vs. exploratory nature of the experience; in the initial painting view, should we draw attention to specific features or let users explore the painting unprompted? We revisited our defined needs and constraints, leading us to create a flow that incorporated both guided and exploratory elements. The initial exploratory view enables data collection, and the subsequent curator walk-through fulfills the educational aspect.

Final User Flow

Final Theme/UI

To avoid detracting from the artwork, we settled on a minimal design and created a design system with custom components derived from font styles, weights, and colors to standardize our designs across 175+ screens. Using seven different colored caption boxes, we aligned caption box colors with the paintings' color schemes to create a more cohesive experience. The museum provided professionally-captured JPEGs of all 11 paintings to ensure the digital representations of the art closely matched their physical counterparts.

Curator Data

As found in our research, users were interested in comparing their data with that of a curator, which necessitated simulated data visualizations reflecting a curator's perspective on the artwork. Data had to be sourced before our site visit, so using the previously identified sequence of key elements for each painting, I guided my co-designer through the artwork during the eye-tracking experience to create curator-like data.

Data Visualizations

The Tobii Pro Nano captures the X and Y coordinates of a user's gaze at a sampling rate of 60 Hz. This results in a substantial amount of data collected during a user's 30-second view of a painting. Our challenge was to present this data in a comprehensible and engaging way.

We generated gaze paths and created heat maps based on the users' X and Y coordinate data. Users experienced a real-time playback of their gaze path, allowing them to visualize their movement through the piece—identifying what caught their attention first and how they navigated between features. Additionally, a heat map illustrates where they fixated most intensely in the artwork. Each data visualization enables users to compare their gaze patterns with those of a curator.

FINAL PRODUCT

Final Prototype

Site Visit

In March 2022, my team traveled to St. Petersburg, Florida, to ensure a smooth handoff with the Salvador Dalí Museum. After a year of remote collaboration and viewing this selection of work online, it was incredibly exciting to meet our clients in person and to see the artwork in real life.

UX Copywriting

In pursuit of a smooth handoff, our developers collaborated with the museum’s IT staff to explain the tech setup while my co-designer and I worked with the Chief Operating and Chief Marketing Officers to finalize copy. Though users can proceed through the experience via fixation on buttons, we also had to manage visitor wait time by timing the experience. We assigned reading times for over 75 captions, including buffers to accommodate diverse reading speeds.

Socials and Press 

At the museum, we were interviewed by the museum’s PR team, who was capturing content for the exhibition’s public announcement. Photographers and videographers documented our visit at the museum, including our private tour with one of the project’s curators, for the upcoming launch.

Additionally, we were interviewed by our campus newspaper. The Dartmouth news published an article about our project and client visit.

REFLECT

Takeaways and Next
Steps

While still in the early stages of my design career, working on a high-impact project for a high-profile client was an incredible and rewarding experience. Creating an experience for thousands of annual visitors was beyond exciting. Having studied both engineering and studio art, I have always been fascinated by the intersection of technology and art, which amplified my passion and enthusiasm for this project. My teammates were equally as passionate about the work as myself. It was reassuring to be on a team where everyone was equally committed to crafting the best possible experience.

Throughout this project, I learned just how important flexibility is in the design process. Constantly emerging client and tech constraints along with outstanding initial questions well into the project demanded flexibility in our technology and design approaches. Moreover, the team composition changed every ten weeks, so I continuously adapted to collaborating with new designers and teammates. As the sole consistent designer throughout these team changes, I helped onboard each new team member. In doing so, I helped maintain the project’s momentum and ensured each team member felt properly integrated into the team and the project.
︿